We are almost a quarter of the way through the season. The Bulldogs and Georgia Tech are off to good starts and the Falcons are up and down.
Something that is mainly up is mobile data usage at football stadiums across the country and Atlanta is no exception.
Below are the top performing venues from the past week as well as a few interesting trends we’ve noticed.
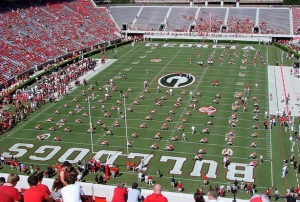
The big games over the Sept. 20-22 weekend in Atlanta and Athens generated some very big numbers – with football fans at Sanford Stadium in Athens ranking fourth among collegiate venues in terms of data usage, logging an incredible 405GB of data – or the equivalent of 1.1 million social media posts with photos. Fans in Atlanta the very next day topped that mark, ranking third among professional sports venues with 471GB of data – or the equivalent of 1.3 million social media posts with photos.
The games yielded the equivalent of almost 2.5 million social media posts/pictures – both ranking Atlanta and Athens among the top 5 venues in the nation. That’s quite a few selfies, a ton of emails and a bunch of web searches.
Top 5 Collegiate Venues by Total Mobile Data (9/18-9/20)
Fayetteville, AR – 669GB
Equivalent to more than 1.9 million social media posts with photos
Tuscaloosa, AL – 591GB
Equivalent to nearly 1.7 million social media posts with photos
Morgantown, WV – 460GB
Equivalent to more than 1.3 million social media posts with photos
Athens, GA – 405GB
Equivalent to more than 1.1 million social media posts with photos
Baton Rouge, LA – 376GB
Equivalent to more than 1.1 million social media posts with photos
Top 5 Professional Venues by Total Mobile Data (9/18-9/22)
Miami – 1086GB
Equivalent to more than 3.1 million social media post with photos
New Orleans – 576GB
Equivalent to more than 1.6 million social media post with photos
Atlanta – 471GB
Equivalent to more than 1.3 million social media post with photos
Buffalo – 386GB
Equivalent to more than 1.1 million social media post with photos
New York – 379GB
Equivalent to more than 1.1 million social media post with photos
Caveats:
– All figures include only data traffic seen on AT&T’s venue-specific mobile network.
– All data metrics come from only venues with a DAS where AT&T’s mobile network is on-air. These metrics are not comprehensive of every game played during this past weekend for professional or college football.
-This data is compiled from only football stadiums that had home games during this selected timeframe where AT&T is on-air on a DAS.
– Regional Separation
– During week 4 of the college football season and week 3 of the pro season some
Finding:
On average this week, pro and college venues located east of the Mississippi River did approximately 25% more data than their western counterparts.


